

Should I Retake the GMAT?
Should you retake the GMAT, and does retaking the GMAT look bad? Manhattan Prep’s Stacey Koprince answers the most common retake the GMAT questions.
Creating an account on mba.com will give you resources to take control of your graduate business degree journey and guide you through the steps needed to get into the best program for you.

After you take an official GMAT™ exam, you can purchase an Enhanced Score Report that contains lots of additional insights about how you did. (That page also links to a sample official score report so you can see exactly the type of data you’d be getting.) In this post, we’ll talk about how to analyze your Enhanced Score Report to help you improve your GMAT score.
A couple of caveats: First, it’s likely that some of your data points will be helpful and some won’t be very helpful, and the exact mix will vary from person to person (literally depending on how you did). Also, every now and then, I run across an Enhanced Score Report (ESR) in which someone’s stats are all “middle of the road.” They didn’t have any big timing problems and they don’t show any relative weaknesses anywhere on the exam. In that case, the ESR overall won’t be particularly helpful for your retake (but this is pretty rare).
Second, as of this writing, you can order an ESR for your test-center GMAT but you can’t order an ESR for a GMAT exam taken online. (You can, though, order a test-center ESR even if you canceled your GMAT scores at the end of the test. That’s great news, as people who cancel their scores are likely to want to retake the GMAT.)
Should you retake the GMAT, and does retaking the GMAT look bad? Manhattan Prep’s Stacey Koprince answers the most common retake the GMAT questions.
I’ll take you through every single data point! GMAC provided me with approximately 75 completely anonymized ESRs (from real test-takers) covering a full range of scores in all sections of the GMAT. I analyzed each ESR and kept track of the overall trends. I’ll explain what each data point means and also show examples of the most common issues that people need to address in order to lift their GMAT scores.
If you’re debating whether to buy the ESR, I recommend reviewing the intro and conclusion paragraphs of this article and also casting an eye over the images to get a sense for the kind of data included in the report.
If you’ve already bought your ESR, settle into a comfy chair, pull up your data, and let’s go! (Warning: This is going to take at least half an hour… and probably longer.)
Before we dive in, keep one thing in mind: You’re looking for data points that stand out from the rest—significantly higher or lower. When everything is about the same, there aren’t a ton of conclusions to draw about what to do differently when you retake the GMAT. The value is in the outliers.
Here’s an example of the first set of data points your report will contain:

This test-taker did a great job overall. The Total score is given on a scale of 200 to 800, so 690 is a great score. This person scored 7 out of 8 on the IR section and also has competitive scores in both the Quant and Verbal sections. Schools like to see more balanced scores in Quant and Verbal rather than a perfect score in one section but a much lower score in the other. And finally, though not critical in most admissions decisions, this test-taker scored a good-enough 4.5 out of 6 on the essay section.
Except for the essay score, you’ll be told these scores as soon as you finish your exam.
The first page of your report will also contain this graph, displaying the average time spent per problem on each section of the exam:

I typically glance at this only briefly, as the later sections of the report go into better detail about your timing. Overall, though, I expect the average times to be about what you see in the graph above for someone who has 1x time on the GMAT. If the numbers are significantly lower, then I know the person rushed through the test.
For someone with accommodations who has been granted 1.5x time on the test, multiply the averages above by 1.5, and for someone who has been granted 2x time on the test, multiply those values by 2.
First, you’ll see your overall score and your percent correct on the Integrated Reasoning (IR) section:

The IR section is scored from 1 (low) to 8 (high) and the average is between 4 and 5, so this person scored above average but still has some room for improvement. Most schools are happy if you score above average on this section, but if you are going for an extra-competitive program or you want to go into banking or consulting, it’s a good idea to aim for a score of 6 or higher.
This test-taker’s time management data shows a good opportunity for improvement:
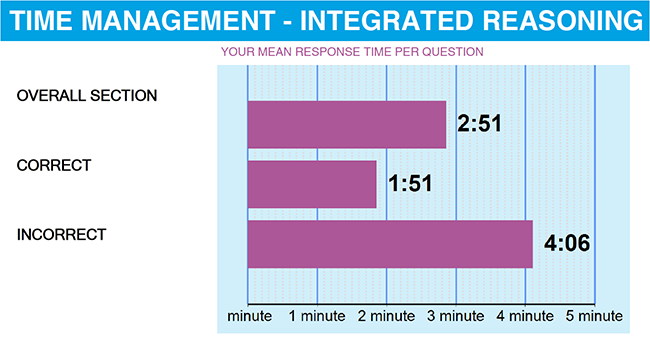
Look how much time this person spent on the problems that they got wrong anyway: an average of 4 minutes!! That might be fine if they missed only one problem, but they missed almost half of the problems, so they spent a lot of their total time on stuff they ended up getting wrong.
Before they take the test again, they have to figure out how to make better decisions about what not to do on the IR section. Bail fast on the hardest 2 or 3 problems in this section—and go into the test knowing how to identify (quickly!) what really is hardest for you.
One other thing to note: There are 12 questions in this section and 30 minutes total, so if someone spent exactly the same time on each question, they’d spend 2 minutes and 30 seconds per question. How can this person’s overall average be 20 seconds higher than that?

Wondering how to finish the GMAT on time? You need a GMAT pacing strategy. Expert Seth Capron of TestCrackers discusses his approach to GMAT timing.
Your ESR shows your performance on all of the questions that counted towards your score, but a small number of questions are what are called non-operational or experimental—that is, these questions are being tested for future use but don’t actually count for you on this test. If the test-taker rushed or guessed quickly on a couple of those experimental questions, then they’d end up with a little extra time to spend on the ones that counted.
(This person got a little lucky; there’s no way to tell which questions are experimental. Just make the call about where you do and don’t want to spend your time based on your own strengths and weaknesses.)
The Verbal Reasoning section is scored on a scale of 6 to 51, but for practical purposes, the top score starts at 45, because all Verbal scores from 45 to 51 are in the 99th percentile (that is, only one percent of all test-takers score 45 or higher on the Verbal section). The top 10 business schools typically want to see a Verbal score in the higher 30s or 40s.
The first verbal report you’ll see is this:

The second graph shows your percentile ranking by problem type. There’s an obvious weakness here: Reading Comprehension. Before I dive into that, one thing to note: Percentile ranking is not the same thing as percentage correct. Your percentile ranking indicates how you performed relative to all of the other people taking the exam within a certain period of time (on the GMAT, this period is 3 years).
So this person did better on Critical Reasoning than 94 percent of all test-takers; that’s fantastic! But this person did better than only 46 percent of all test-takers on Reading Comprehension, so there’s definitely room for improvement on this question type.
For this graph, look for differences of about 15 percentile points or more. If two question types are within about 15 percentile points of each other, that’s within the “noise” always created by any statistics—the two data points are really about the same. But if the differential is at least 15 percentage points, take note (and if it’s much larger, as it is here, there’s a pretty significant weakness).
Next, you’ll see average time per problem for each problem type:

This data reinforces the fact that Reading Comprehension (RC) is problematic for this test-taker—they’re spending more time on RC than expected on average and yet underperforming.
In general, Sentence Correction (SC) is the fastest verbal question type. Look to average in the 1:10 to 1:30 range on SC. Aim for Critical Reasoning (CR) to be in the 1:50 to 2:10 range and Reading Comprehension in the 1:35 to 1:55 range. (CR takes longer because, on RC, you answer three or four questions based on the same passage; on CR, each argument has just one question.)
If you’re naturally faster at one of these question types and you want to shift some time to another type, go for it—as long as you’re not going so fast on your “naturally faster” type that you’re losing points to careless mistakes.
If you find that your percentile ranking for a certain question type is 15+ percentile points lower than the others and your time is slower than the expected average for that type, one possible move is to guess fast on a few questions of that type and reallocate that time to the other question types. Basically, sacrifice a few of these “This is a weakness anyway” problems and spend that time on problems that are more likely to pay off.
If you find that a certain question type is lower but faster than it should be—and you weren’t going fast on purpose—consider whether you might be losing points to careless mistakes because you’re rushing. In this case, you might need to reallocate time from elsewhere in order to stop making mistakes on questions that you already know how to answer.
Next, you’ll see a breakdown of your Verbal section performance by type of skill—for example, grammar vs. communication for Sentence Correction.
While the data in this section can be meaningful, it is limited by the fact that there are only two sub-categorizations per problem type. I'll show you what to look for, but if it turns out that your percentages are all pretty similar, you still have plenty of useful data in the rest of the report.

Sometimes, I’ll see a pretty significant discrepancy, as is the case in the Reading Comprehension and Critical Reasoning graphs in this example. This test-taker did a great job with understanding information that was explicitly stated in Reading Comprehension passages but really struggled to infer from the passage. Likewise, this person did well when dealing with Critical Reasoning argument structures or plans, but they struggled more to critique or evaluate arguments.
More of the time, though, the data points are pretty close together, as in the Sentence Correction example. When the data points are this similar, they don’t tell you a whole lot.
The fact that each verbal question type is broken down across only two skills makes this data less likely to be helpful. The quant section, in contrast, breaks down the problems across five different skill groupings; that greater level of granularity is more helpful.
Next, what do each of these categories mean? The Reading Comprehension (RC) categories are the most straightforward because the Official Guide for GMAT Review has an explicit categorization for Inference questions vs. other kinds of RC problems. The other two groupings, however, don’t map as cleanly to the categories listed for each problem in the GMAT Official Guide (OG).
For Critical Reasoning, I assume that Analysis/Critique refers to the OG problems labeled Argument Evaluation and that Construction/Plan refers to both Argument Construction and Evaluation of a Plan. For Sentence Correction, I think Communication refers to issues around meaning while Grammar refers to, well, grammar. Meaning includes things such as ambiguous or illogical wording, redundancy, word choice, and, I would guess, idioms.
Now we get to some meaty data—and a chance to really flex your analytical skills. You can use the data in this section to get a sense of your performance trajectory across the entire test—but you’ll need to evaluate the three graphs on this page together in order to do so.
All three split up your test into four roughly equal quarters, or quadrants. (As before, you’re seeing the data only for the operational questions—the ones that counted for you. All experimental data has been stripped out.)
Here’s the first one, Percent Correct:

For Percent Correct, you’re given your accuracy over the four quadrants. Ideally, you’d like to be decently steady across the test, though you will certainly have ups and downs. (Also, because this is an adaptive test, you will definitely get questions wrong, even if you end up with a great score.)
This particular test-taker was very accurate in the first and third quadrants but had a pretty rough time in the second and fourth quadrants. What happened?

The second graph on this page shows average difficulty in each of the four quadrants. You can roughly think of this as the person’s scoring trajectory. In the first half of the test, this test-taker lifted their verbal score (green line), but in the second half, their verbal score dropped. In fact, it dropped far enough to fall below their starting point. (The test starts us all roughly in the middle in terms of difficulty.) Why did this person start out by lifting but drop by the end of the test?

Ah, now it’s starting to come together. The third set of data shows your average time per problem by quadrant. On the Verbal section, if you have 1x timing, then you have a bit less than 2 minutes, on average, to spend on each problem. This person spent too much time in the first two quadrants and had to rush in the second half of the test—and especially in that final quadrant.
Also, in the first quadrant, this test-taker spent a lot of extra time on the (maybe 2?) questions that they missed (signified by the proportion of the pie chart that is red). Likewise, in the second quadrant, they spent a little more time, on average, on the ones they got wrong.
Look back across all three graphs together. What story do they tell collectively?


This test-taker was pretty accurate in the first quadrant and lifted their score accordingly—and they didn’t actually have to spend extra time on the ones they got right! They did, though, spend too much time on incorrect problems and probably used up a decent amount of mental energy by spending so much extra time on those. Double-whammy.
When you get lots of questions right, the test gets progressively harder; that’s how a question-adaptive test like the GMAT works. So in the second quadrant, this person kept spending lots of time and mental energy because the questions were harder… but started doing worse, also because the questions were harder. As the test-taker progressed, they likely became aware that they were getting more and more behind on time. When you know that’s happening, it’s a lot harder to concentrate and you start to make more mistakes.
So the test-taker missed a bunch of problems in the second quadrant (understandably! the problems were hard!) and their score came back down, but the score came down so far that the test-taker was now able to answer a bunch of questions in the third quadrant correctly even though they were working really quickly. There’s a good chance that this person missed questions in quadrant 2 that they would have been able to answer correctly if they hadn’t been mentally tired or panicking over the time or both. And so, by the time they got into the third quarter of the test, the problems they were being given were actually below the level they were normally capable of answering correctly.
Finally, in the fourth quadrant, the test-taker simply ran out of time. They had barely over one minute per problem to spend in the last quarter. Either they did answer every question but rushed to do so—and therefore made careless mistakes on some—or they literally ran out of time without finishing the problems.
On the GMAT, if you don’t answer all of the problems in the Quant or Verbal sections, the algorithm will “run” the rest of the test as though you were given the rest of the problems but you got each one wrong. So, if you still had five questions remaining when the clock ran out, it would say, “Okay, I would have given you this one next, and you would have gotten that wrong, so your score would drop to this level, and then I would’ve given you this one… and you would have missed that one, too…” all the way to the end of the section. Since the test is adaptive, your score drops after each “missed” question. If you run out of time with only one or two questions to go, you might not experience a drop (unless you’re at the top end of the scoring range). But if you have five or more questions to go, that’s really not going to be good for your score.
On your first pass through the three graphs on this page, notice the trends but don’t draw conclusions yet. Then look at all three sets of data together to see whether you can figure out why any particular trend or data point is what it is. If everything is steady throughout, there won’t be much of a story here—but if you have real ups-and-downs in any one graph (or in all of them!), then there’s something to figure out that may help you to improve your performance when you retake the GMAT.
Like the Verbal section, the Quantitative Reasoning section is scored on a scale of 6 to 51. The percentile ranking scale is very different, though, than the one used for the Verbal section. Percentile rankings tell you how well you did relative to everyone else taking the test within a given period of time (3 years, on the GMAT). On the Verbal section, a score of 45 is the 99th percentile—i.e., you scored better than 99 percent of the people who took the GMAT in the past 3 years. But on the Quant section, the percentile ranking for a score of 45 is only in the 50s.
Why? Although the two sections of the exam use the same number range (6 to 51), don’t think of the scoring scale as equivalent. On the Verbal section, the top schools want to see a score of about 36 or higher (corresponding to percentile rankings of around 80% or higher). But on the Quant section, the top schools are typically looking for a score of about 45 or higher, which corresponds to percentile rankings of around 50 percent and higher.
It may seem odd to you that the quant percentile ranking is so much lower for the “same” score of 45. Think about it this way: It takes a specific level of quantitative skill to earn a score of 45, or a 48, or the top score of 51. The skill level needed to earn that score doesn’t change regardless of the percentage of test-takers capable of earning that score. So most business schools don’t actually care about the proportion of people who earn a certain score.
Rather, they care that you have demonstrated a certain level of quant competence so that they know you can handle the quantitative aspects of your courses in business school. For the top schools, the “good enough!” level is about a score of 45 (or higher) on the Quant section.
Here’s what the first page of your Quant report looks like:

You’ll first see your overall score, followed by two cuts of “sub-section” percentile rankings for Problem Solving (PS) vs. Data Sufficiency (DS) and for Arithmetic vs. Algebra and Geometry. As with the Verbal sub-section rankings, ignore any differences that are within about 15 percentile points. In this test-taker’s case, I’d ignore the difference in ranking for arithmetic vs. algebra.
But PS vs. DS is another matter. This person definitely underperformed on DS relative to PS. And here’s the last graph that appears on this page:

Notice anything? On Quant, we’re supposed to average about 2 minutes per problem. This person spent a lot of extra time on PS problems and was absolutely racing on DS problems as a result. Was this test-taker truly actually worse at DS? Or were they just falling into lots of traps and making mistakes because they were working too quickly on DS?
I see this pattern all the time in my students’ practice tests. People feel more comfortable with PS than DS (because PS feels more like the math we did in school), and they interpret that as being better at PS than DS. But when I make them try the DS problems with normal time—not artificially rushing themselves—suddenly their performance shoots up. They’re not actually bad at DS! They just think they are because DS feels weirder.
This student is also showing a timing discrepancy between arithmetic (on the faster side) and algebra/geometry (slower). Putting this together with the PS/DS data, I’d hypothesize that this student is spending too long on hard “textbook-level” calculations on PS problems and then trying to save time by cutting corners on DS and on what they might view as “easier” arithmetic problems… and possibly shooting themselves in the foot on both categories.
If you see something that you know you don’t know how to do, then yes, guess quickly and move on. But don’t rush artificially and sacrifice problems that you might actually get if you spend a reasonable amount of time in order to spend extra time on problems that are harder—and therefore have less likelihood of paying off.
The reverse problem can also exist. Here’s data from another test-taker:


This test-taker performed much worse on arithmetic problems and spent extra time on them. The discrepancy in percentile ranking is great enough here that this person does need to spend some additional time studying arithmetic; they’re not going to get far in lifting their quant score if they leave their arithmetic skills at that level.
But this person also needs to start making some different decisions during the test. Specifically, they need to start cutting off some of these problems that are weaker for them—just guess and move on.
Take the time you save and spend it instead on a problem that is generally stronger for you. Maybe it’s a harder one than average or it has a few more steps than the average problem, but you know you know how to do it. In that case, feel free to toss an extra 30 seconds at it. Invest time where it has a real chance to pay off.
But don’t toss an extra 30 seconds at a problem that tests something you don’t like or that you know is an area of weakness for you. And never put extra time toward a problem that has you thinking, “I should be able to figure this out” or “I don’t know what to do now, but I’m sure I can figure this out if I just keep going!” (That is: I’ve been trying this problem for a minute or two already and I’m stuck and being stubborn. I need to let that go!)
Okay, lecture over. Let’s take a look at the next page.
The first graph on this page will break your performance down across five major buckets of quant topics:

I’d ignore differences within about 15 to 20 percentage points, but pay attention to greater discrepancies. This test-taker needs some work on the topics in the third and fifth categories.
What exactly do these categories mean? Some are obvious (geometry) and some are less so (value / order / factors). You can read a full description of each grouping in the Official FAQs for the Enhanced Score Report (click on the FAQ tab at that link). The Value/Order/Factors grouping covers topics such as absolute value, decimals, exponents, factors and divisibility, number lines, place value, positives/negatives, and remainders. The Counting/Sets/Series grouping covers counting (also known as combinatorics), estimation, overlapping sets, series, and sequences.
Consider how this data fits the data you saw on page 7 (DS vs. PS and arithmetic vs. algebra/geometry). Here’s another test-taker’s performance by fundamental skill:

Page 7 of this test-taker’s report (not shown) indicates that they scored in the 39th percentile on Algebra/Geometry compared to 63rd for Arithmetic and spent a whopping 2 minutes 32 seconds on average on each Algebra/Geometry problem! Low and slow. So the collective data is showing strongly that this test-taker needs to work on their Alg/Geo skills.
This test-taker, by the way, scored 46 on the Quant section and 700 overall. You can score really well on the GMAT and still get lots of problems wrong and have below-average data points—that’s how an adaptive test works.
Because there are five different quant skill groupings, you’re more likely to find usable data here than in the equivalent graph on the verbal side. But it’s also possible that your performance was pretty even across all topics—in which case, ignore this particular graph.
The rest of page 8 and page 9 combined provide the same three graphs we saw earlier in the Verbal section—the ones that I said you had to analyze collectively. You’re going to do the same for the quant section.
This test-taker shows a similar pattern to the one we saw in the Verbal example earlier. I see this even more often on the Quant side of the exam:

The test-taker started out strong, but then was really up and down for the rest of the test.

The test-taker lifted their score in the second quadrant (which makes sense since they got almost everything right in the first quadrant), but then dropped down again and finally recovered a bit by the end of the section.

And the timing explains why. They had an average of only 21 seconds per problem to spend in the last quadrant! So either they just made quick guesses in order to finish the test or they spent normal time on maybe two problems in that entire quadrant and blindly guessed or ran out of time after that.
As in the earlier Verbal example, this person got a lot right in the first quadrant, but unlike the Verbal example, this test-taker had to spend a lot of extra time even on the ones that they got right. There are three broad messages in this timing data.
⭐ Message #1: Let it go! Don’t spend 3+ minutes on any single problem! It’s just going to derail the rest of your section.
⭐ Message #2: Even if we remove that one really long (and wrong) problem in the first quadrant, this person still did need a bunch of extra time to get to 86 percent correct. So they probably do not (yet, anyway) have the capability to maintain that level of performance all the way to the end of the section. But they probably do already have the capability to score higher than the 42 that they ultimately earned in this section.
The GMAT is essentially a “Where you end is what you get” test. This person lifted up, dropped, lifted up again, dropped again, and then the section ended. And where they ended is what they scored. If they could have maintained a steadier performance—not lifting so high at the start but also not dropping so low in the middle—there’s a decent chance that they would have ended at 43 or 44 or maybe even 45 rather than 42.
⭐ Message #3: Here’s what happened in quadrant 2. They were given a string of really hard questions (because they did so well with the first grouping of questions). So, naturally, their accuracy went down. But they kept spending nearly as much extra time—and it was no longer paying off! They stole time from quadrant 4 right here and there wasn’t even a good reward for that investment—they missed those problems anyway.
This is how the test works. The algorithm is trying to find your upper limit—and it’s going to succeed! So lift your score up towards the peak of your ability, yes, but then you have to (sing it with me) Let It Go. Save that time and mental energy for other problems…ones that you actually have a chance to answer correctly as long as you aren’t rushing because you spent too much time elsewhere.
Here’s another test-taker who also had a time management problem but with a somewhat different pattern:

Unlike the earlier test-taker, this person had their highest percent correct (data not shown) in the first and fourth quadrants but dropped in the second and third quadrants. And again, the timing shows why.
This person was accurate but spent too much time in the first quadrant (and that extra time went to incorrect problems, by the way). When they got to quadrant 2, it looks like they did guess quickly on some hard problems in order to catch back up—that was a good call—but it also looks like they overcorrected and kept doing that long beyond necessary (through the end of quadrant 3).
This is where I’d ask questions. Were you aware that you were behind on time? If so, what did you do to catch back up? At what point did you finally realize that you’d actually gotten ahead on time? And what did you do then?
When you first realize that you’re going too slowly and need to speed up, it’s really easy to take it too far. It can take a few tries to find a good equilibrium that addresses the original problem (I’m behind!) without creating a different problem (I’m way too far ahead / I bailed or rushed on too many problems). Use practice tests to help you find this equilibrium.
This test-taker got back on time sometime during the second quadrant, but they continued to rush or guess quickly on a number of problems anyway. It wasn’t until they got to the fourth quadrant that they seem to have noticed that they were okay and stopped panicking and started to work more calmly again.
By then, though, the damage was done. This test-taker likely underperformed relative to what they might have been able to score with a steadier performance across the whole section.
That word steadier is the key to my baseline advice to you. The best way to maximize your score on an adaptive test like the GMAT is to have a pretty steady performance overall. It’s okay to get a few minutes behind (or ahead) and then catch back up. It’s okay to have a few questions wrong in a row. But when you start to get 10 minutes behind or you start to miss 6 out of 8 questions, your score is going to drop quite a bit.
The GMAT is testing you on your executive reasoning skills. It is literally going to give you problems that it expects you to get wrong because it wants to see whether you have the executive mindset to (a) recognize that this problem is a bad investment and (b) make the call to let it go—exactly the kinds of calls that every good executive has to make every day at work.
Last but not least, you’ll receive feedback on your essay score. Generally speaking, you’re just looking to get a “good enough” score on the essay section, which is scored on a scale of 0 to 6.

First, don’t be put off by that percentile ranking. About 80 percent of test-takers earn a good-enough score on the essay section—that’s why the percentile ranking seems so low. Focus on the score: a 4.0 or higher demonstrates a good-enough baseline writing competency.
As with all the other data in this report, look at the relative differences. This person was strongest in Communication and weakest in Organization, so before they retake the test, they can work on better organizing their writing. The Relevancy category has to do with how relevant the examples or points are relative to the argument that you’re analyzing, so this person also may need to practice brainstorming examples that are more relevant to the argument at hand.
If you score a 4.5 or higher, don’t spend any time working on the essay for your retake. If you score a 4.0, spend a little time just to ensure that you don’t drop below 4.0 next time—but don’t worry about it too much. If you score below a 4.0, do spend some time trying to improve your essay-writing skills before you retake the GMAT.
✔ Principle #1: The useful data is in the outliers / differences.
If a set of data points is pretty much the same across the board, it doesn’t tell you much. But if one data point is a lot lower or higher than another, now you have something to work with.
✔ Principle #2: Find the story in the data.
As you understand the data in each individual graph, think about how that graph combines with others to flesh out the story of your overall performance in that section or on that question type. Ask yourself questions like the ones that I listed (“Did I know that XYZ was happening in the moment? What strategy did I employ when XYZ happened? Would I want to do the same thing next time or is there a better reaction? And is there anything I can do to avoid getting into that position in the first place?”)
✔ Principle #3: To improve your GMAT score, aim for a steadier performance.
You will always have strengths and weaknesses and you will have ups and downs during the test—we all do. Overall, though, your goal is too smooth out those ups and downs as much as possible. You don’t want to spend way too much time on certain problems and then rush excessively on others—or crash and burn at the end of the section.
Nor do you want to be amazing at Sentence Correction but get every single Critical Reasoning (CR) problem wrong. Huge outliers like that will bring your score down. It’s fine, though, to know that functions or combinatorics are not your thing or that you just don’t like CR Describe the Role (aka boldface) problems—and to decide that you’re just going to guess fast when you see those kinds of problems. (This is better than fine, in fact. This is exactly how you’re going to avoid messing up your time management on the exam!)
If you do find yourself behind at some point or you find yourself wishing that you’d picked a different answer to that problem that you just submitted… take a deep breath and let it go. Executives don’t make the right decisions every single time—but they do make decisions and move on. Don’t dwell on what’s already passed. Focus on how to best spend the remaining time you have.
If you’re planning to retake the GMAT and you don’t already have a strong idea of what you need to improve, then I would consider buying the Enhanced Score Report.
Taking a standardized test is stressful. You may not fully remember what happened during the test. You may know you ran out of time, for example, but you may not have a good idea of what caused you to do so. And you may think you have a weakness that is actually explained by something else. I talk to people all the time who think they’re bad at Data Sufficiency, but it turns out that they’re selectively spending too much time on Problem Solving (and therefore not enough on DS).
The data in the report can help you to figure all of this out. I do have to add the caveat that there’s not a 100% guarantee that your data will be useful. It’s usually the case that some of your data points will be useful and others won’t be, depending on your individual performance on the test. But I do run across a report every now and then that is so middle-of-the-road across all of the data points that there’s nothing useful to be gleaned in the entire thing. In general, though, that’s rare. Most of the time, there are good insights to be gained.
If you’re looking for more study resources, check out Manhattan Prep’s GMAT Free Starter Kit. You’ll find a wealth of free resources covering Foundations of Math and Foundations of Verbal to help plug any significant holes in your skills. And you’ll find free lessons on time management, Data Sufficiency, Sentence Correction, and more.
Good luck on your retake! Happy Studying!