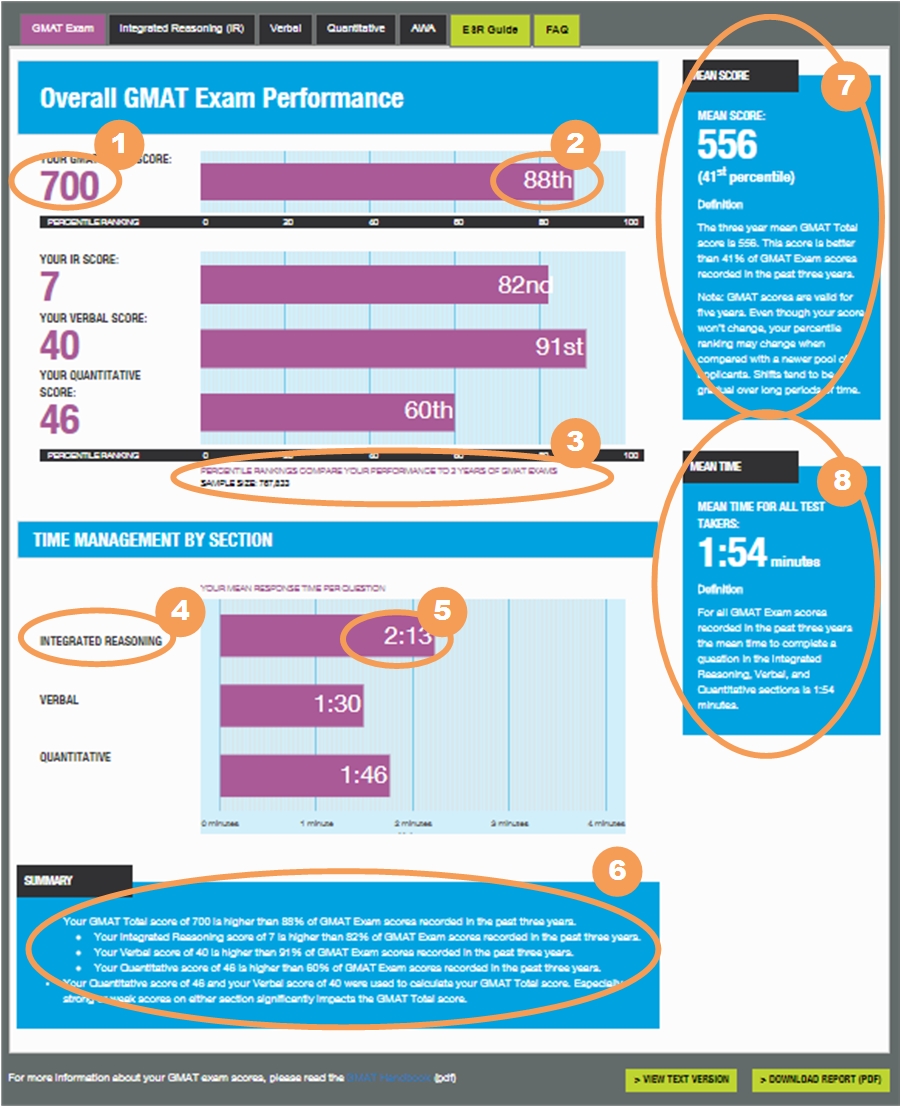
Your GMAT Total Score:
640
Your AWA Score:
PERCENTILE RANKINGS COMPARE YOUR PERFORMANCE TO 3 YEARS OF GMAT EXAMS
Sample Size: 282,098
YOUR MEAN RESPONSE TIME PER QUESTION
Integrated Reasoning
Verbal
Quantitative
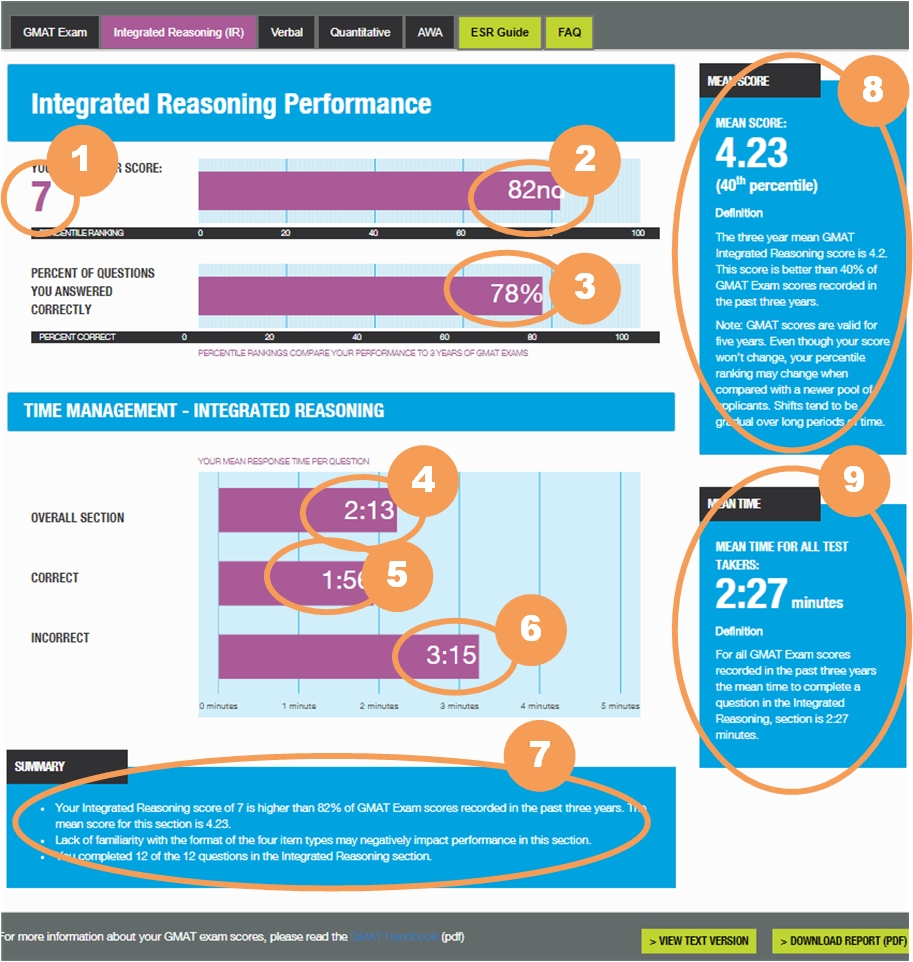
Your Overall IR Score:
3
Percent of Questions you answered correctly
Percentile rankings compare your performance to 3 years of GMAT exams
Your Mean Response Time Per Question
Overall Section
Correct
Incorrect
Your Overall Verbal Score:
34
Critical Reasoning
Reading Comprehension
Sentence Correction
PERCENTILE RANKINGS COMPARE YOUR PERFORMANCE TO 3 YEARS OF GMAT EXAMS
Sample Size: 282,098
Your Mean Response Time Per Question
Overall Title
Critical Reasoning
Reading Comprehension
Sentence Correction
Percent of Correct/Incorrect Answers
Average Difficulty Per Question
Average Time Per Response*
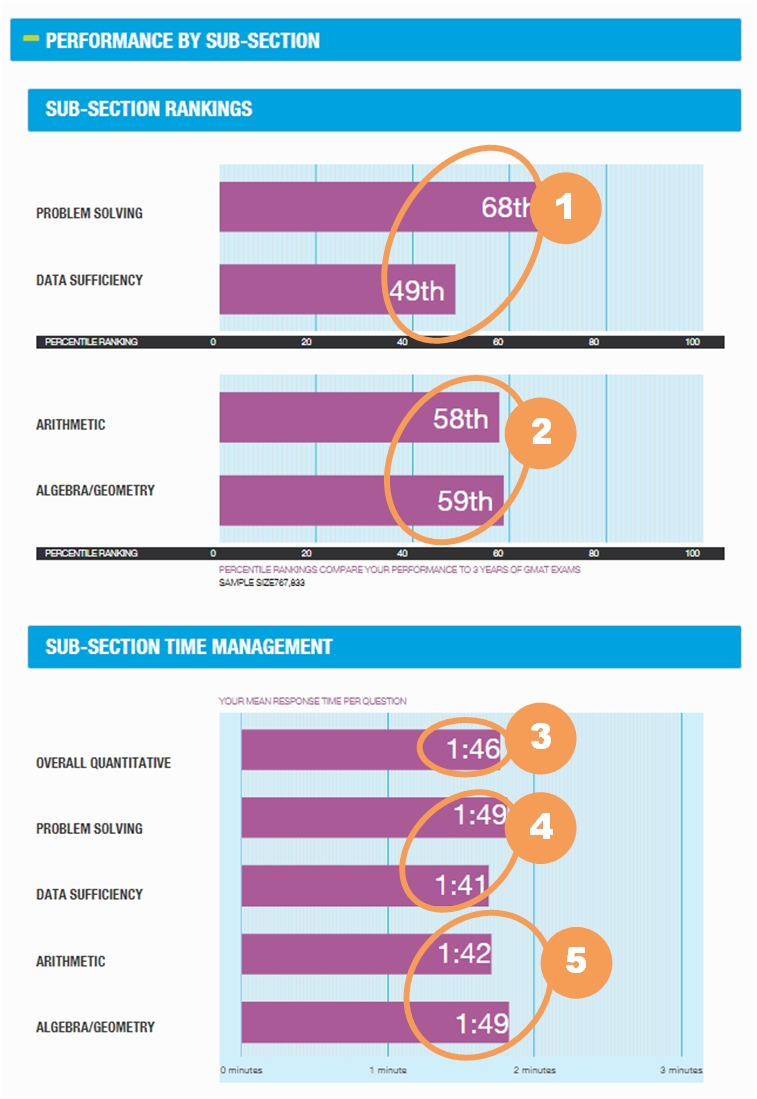
Your Overall Quantitative Score:
44
Problem Solving
Data Sufficiency
Arithmetic
Algebra/Geometry
Percentile rankings compare your performance to 3 years of GMAT exams
Sample Size: 282,098
Your Mean Response Time Per Question
Overall Quantitative
Problem Solving
Data Sufficiency
Arithmetic
Algebra/Geometry
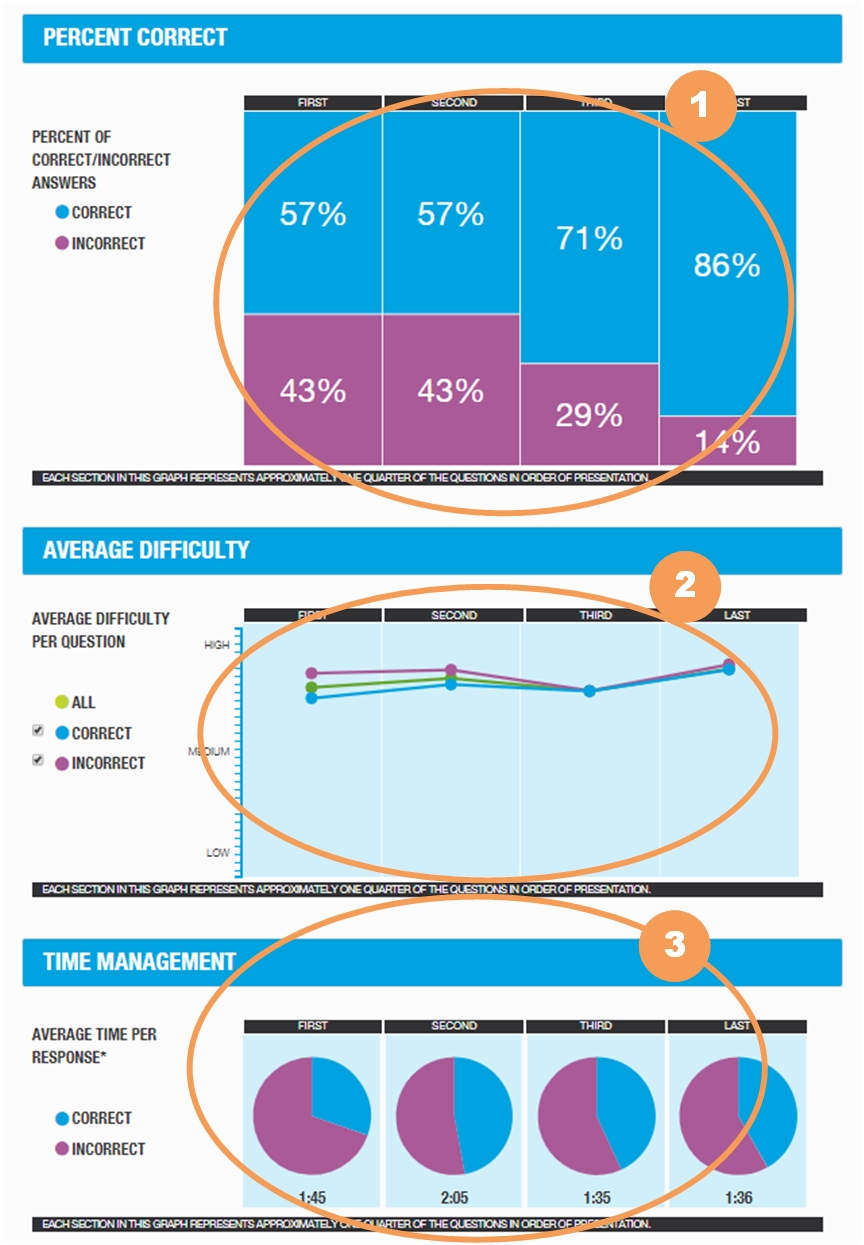
Percent of Correct/Incorrect Answers
Average Difficulty Per Question
Average Time Per Response*
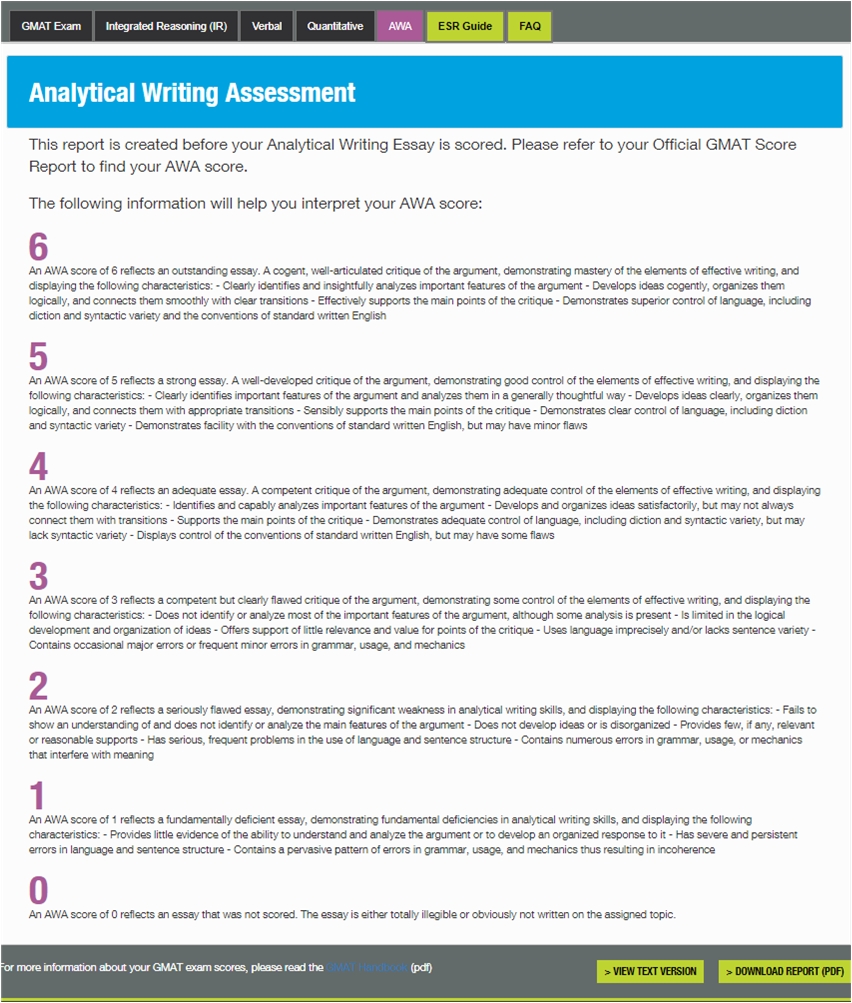
Your Overall AWA Score:
5
This website provides your GMAT Enhanced Score Report in three different ways:
|
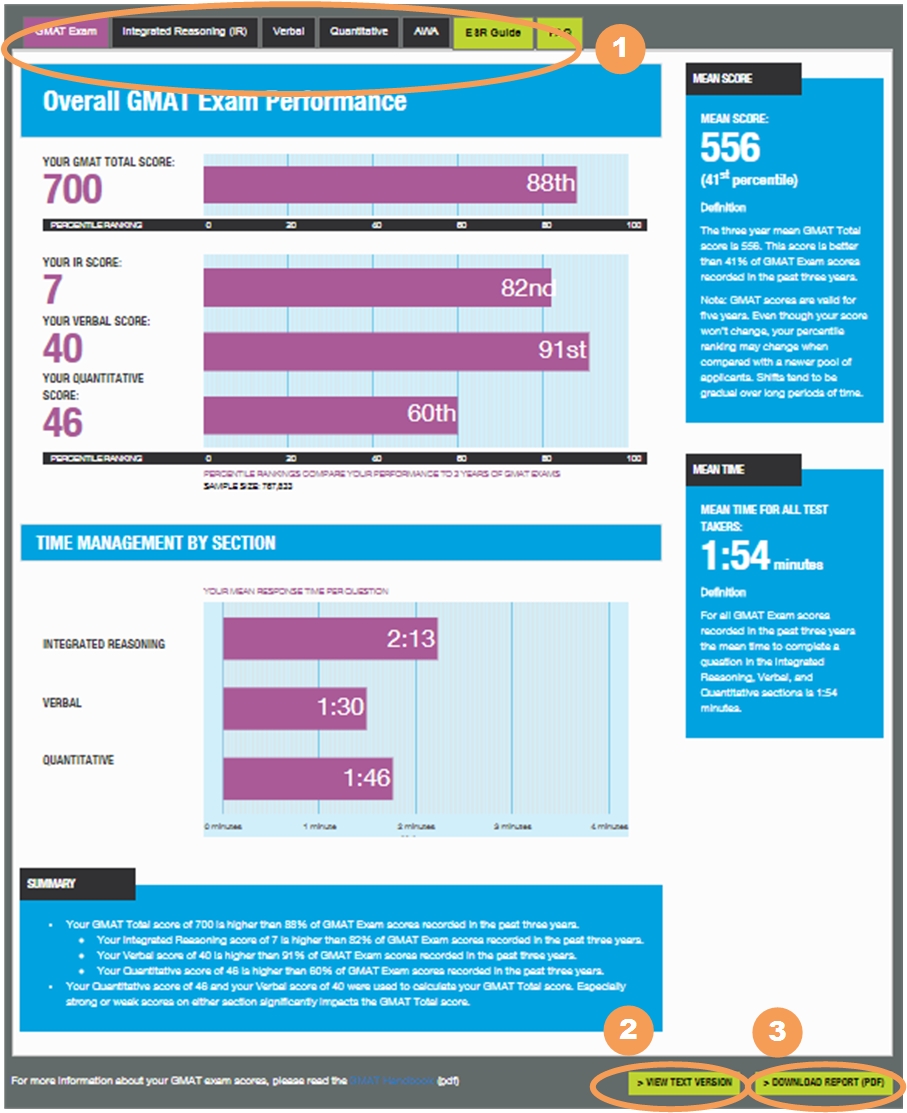 |
This tab displays information about your GMAT Total score and each Section score. Some of the information on this page is found on the Official GMAT Score Report, some is new.
|
 |
|
This tab displays information about your Integrated Reasoning Section performance, including the percentage of questions that you answered correctly.
|
 |
|
This tab displays information about your Verbal section performance, including how well you did by sub-section, percent of questions answered correctly, difficulty level of the questions you saw and how you managed your time.
|
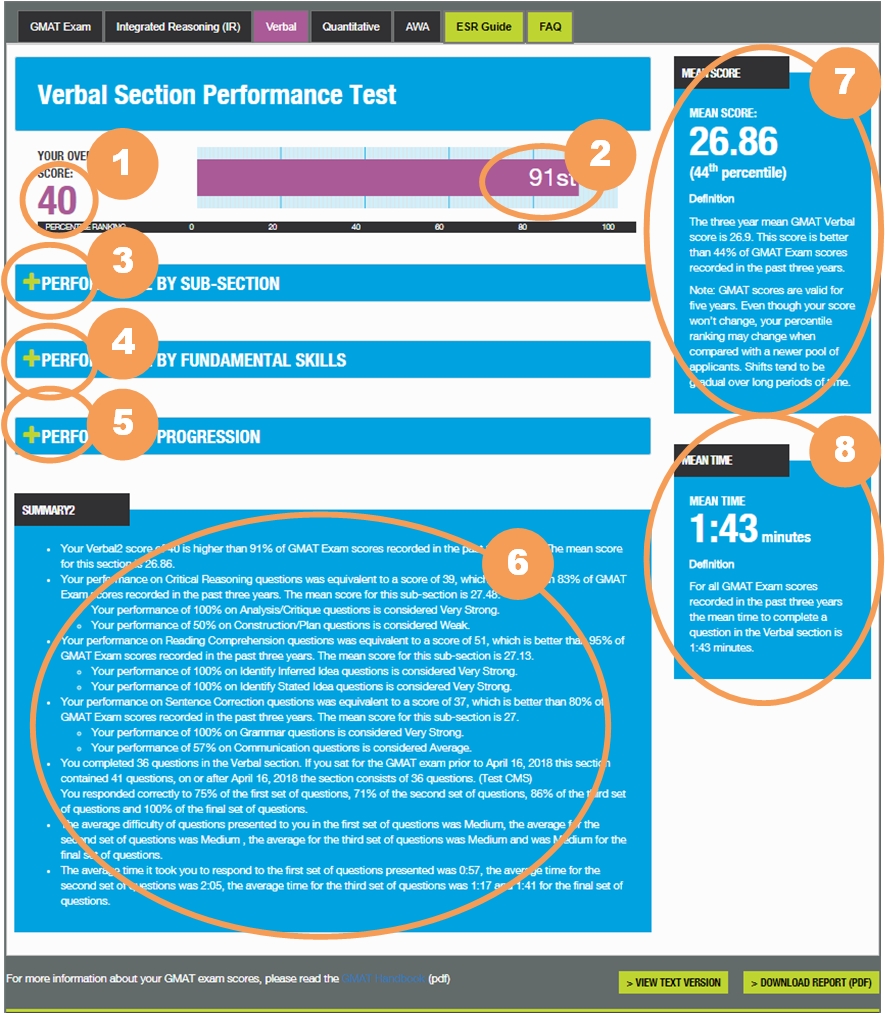 |
The Performance by Sub-Section portion of the GMAT ESR provides a view into your performance by the type of question. Each question in the Verbal section is either a Critical Reasoning, Reading Comprehension or a Sentence Correction question.
|
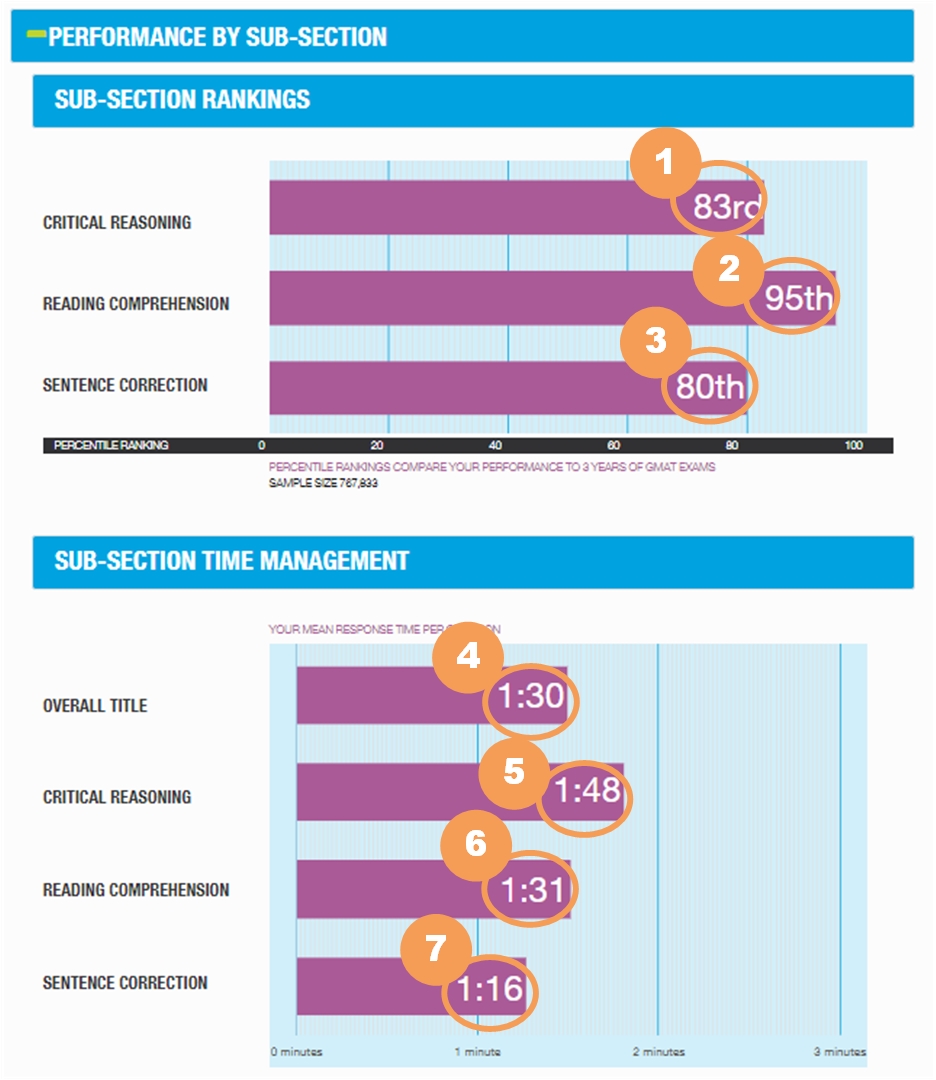 |
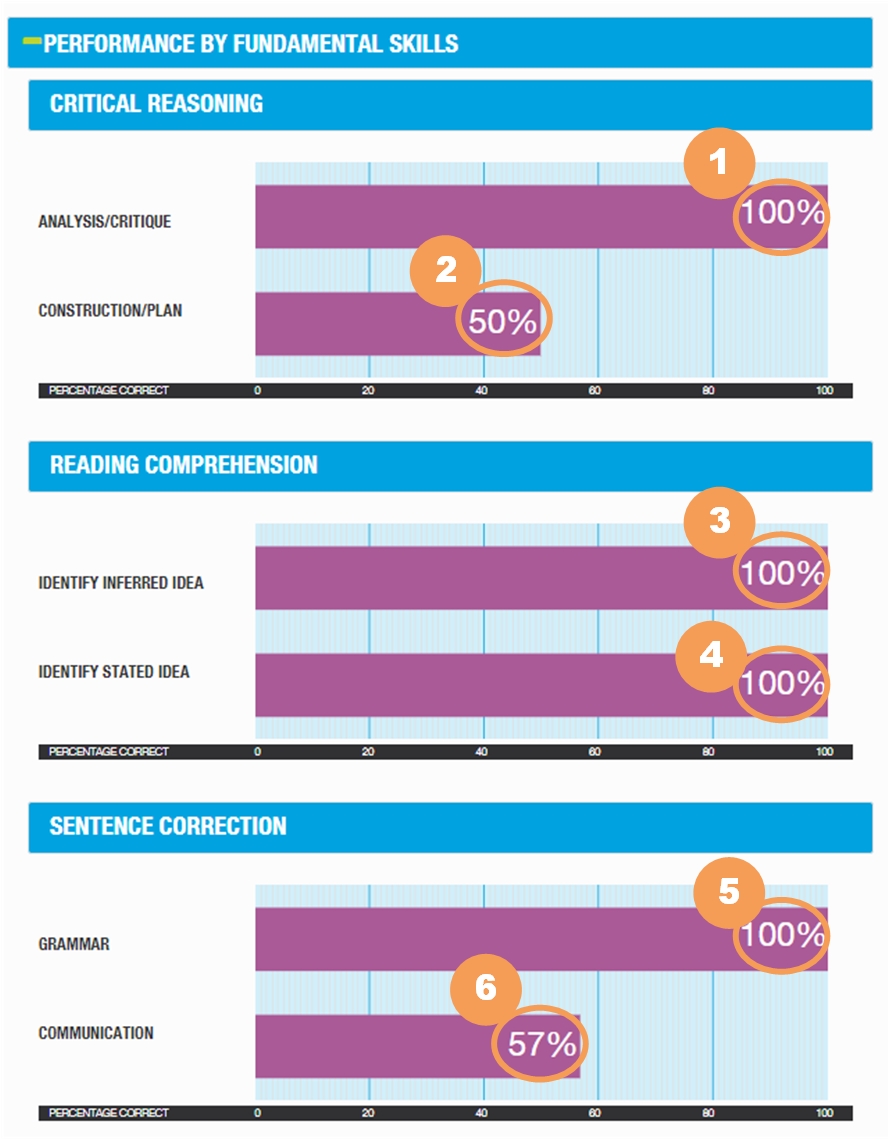
The Performance by Fundamental Skills portion of the GMAT ESR provides a view into your performance by providing information about the underlying skills of the questions.
|
 |
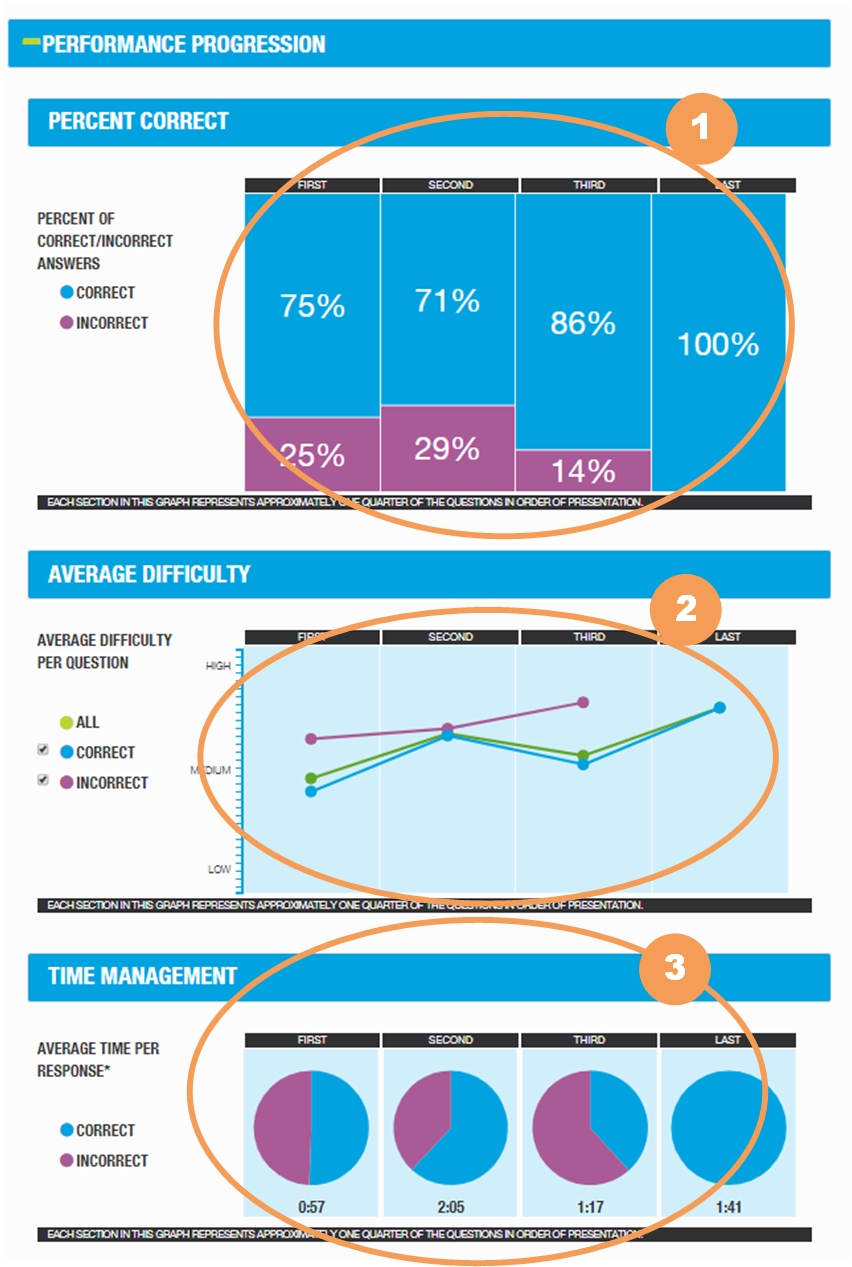
The Performance Progression portion of the GMAT ESR provides a view into your performance throughout the 41 question Verbal section by dividing the questions into four approximately equal parts so you can see how you did from the beginning to the end.
|
 |
This tab displays information about your Quantitative section performance, including how well you did by sub-section, percent of questions answered correctly, difficulty level of the questions you saw and how you managed your time.
|
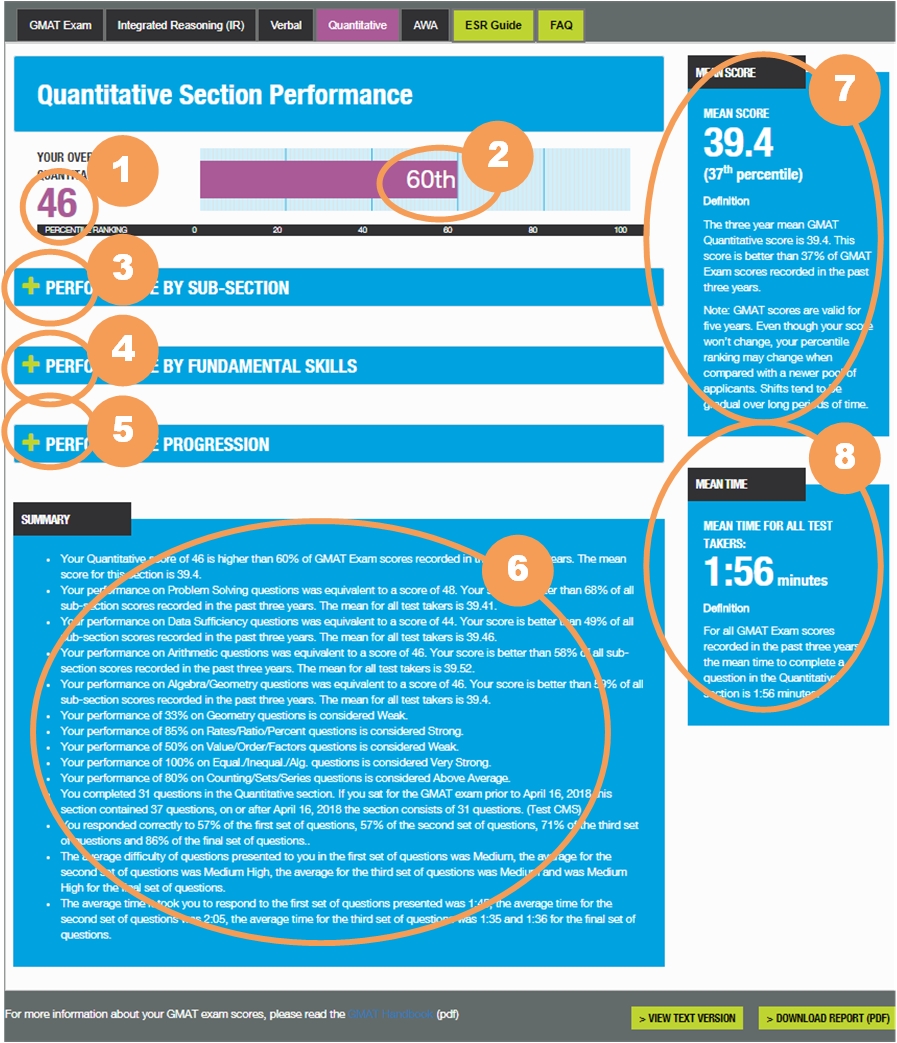 |
The Performance by Sub-Section portion of the GMAT ESR provides a view into your performance by the type of question. There are two Sub-Section groupings in the Quantitative Section: Problem Solving vs. Data Sufficiency and Arithmetic vs. Algebra/Geometry
|
 |
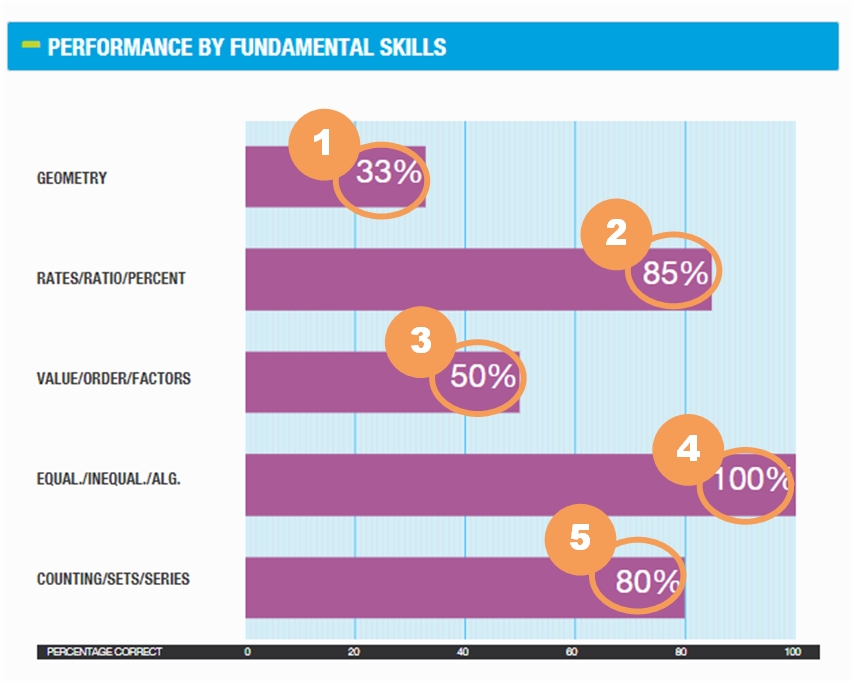
The Performance by Fundamental Skills portion of the GMAT ESR provides a view into your performance by providing information about the underlying skills of the questions. Visit GMAT Quantitative Fundamental Skills to learn more about the information in this chart.
|
 |
>The Performance Progression portion of the GMAT ESR provides a view into your performance throughout the 37 question Quantitative section by dividing the questions into four approximately equal parts so you can see how you did from the beginning to the end.
|
 |
|
The ESR is calculated using the data that supports in your Unofficial Score Report. Since this data does not include the AWA score it is not available in the ESR, however the AWA tab does include an explanation of what each score represents so that you can use it as a reference once you receive your Official GMAT Exam Score Report. |
 |
The Frequently Asked Questions section (FAQs) provides answers to questions commonly asked by users.
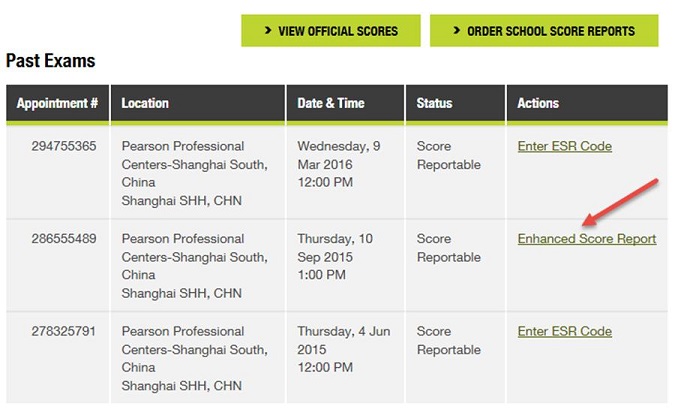
To get an updated URL visit mba.com/mygmat, click the Enhanced Score Report button and within a few minutes you will receive an email with a new URL, which will be active for 24 hours. You may repeat this process as many times as you like to view an available ESR.
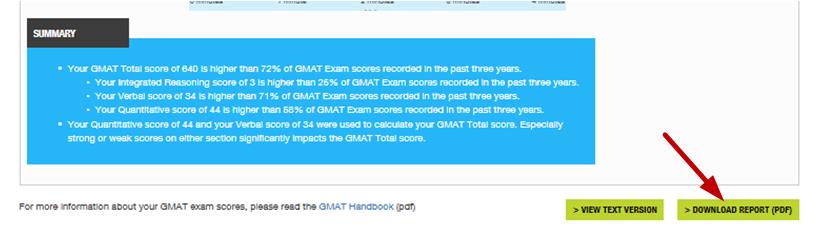
No, it doesn’t matter from which page you launch the PDF version of the GMAT ESR because it is a single all-inclusive view of the information available on all five report tabs.
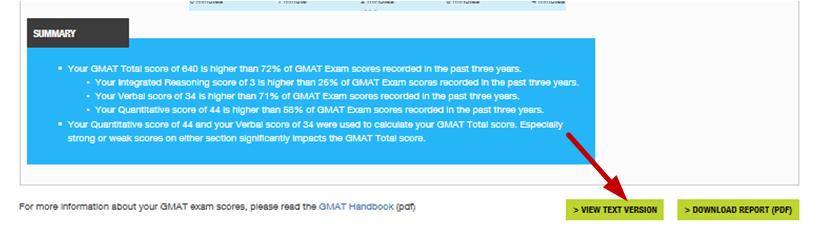
No, it doesn’t matter from which page you launch the text version of the GMAT ESR because it is a single all-inclusive view of the information available on all five report tabs.
The Text version of the ESR is the best layout to utilize accessibility tools. It includes information from all 5 tabs, regardless of the page from which it is launched.
At this time the GMAT ESR is available only in English. If you prefer to view the information in another language the Text Version of the ESR allows users to easily copy and paste into translation tools.
The TXT version can be launched by clicking the "VIEW TEXT VERSION" button on the bottom right side of each tab.
The adaptive nature of this section creates a unique experience for each test taken. The Performance by Progression information provides insight into each testing experience. The number of questions in the Quantitative and Verbal sections are divided into four semi-equal groups.
This allows you to see:
Section
The highest grouping of questions in the GMAT exam. Sections include Integrated Reasoning, Verbal, Quantitative and AWA. Section scores are included in Official GMAT Score Reports.
Sub-Section
This refers to a subset of properties about a question, for example each Verbal question is either a Sentence Correction, Reading Comprehension or Critical Reasoning question. Sub-section scores are not included in the official scores, but can help you understand your performance to help you better understand your strengths and weaknesses.
Problems whose primary focus involves using a function that is explicitly defined in the statement of the problem. The function could be well known but outside the scope of assumed GMAT background knowledge, such as the greatest integer function, or the function could be a randomly made up function that is to be used in solving the problem.
Every question in the Quantitative Section has two distinct components, each question is composed of one Type and one Topic.
Type
Problem Solving OR Data Sufficiency (each question requires problem be solved OR determine if there is enough data for the problem to be solved)
Topic
Arithmetic OR Algebra/Geometry (each question falls within one of three disciplines but because of volume, Algebra and Geometry questions have been grouped )
Each GMAT exam is so unique, that specific information about a particular question could be misleading for those preparing to sit for the GMAT again. Here are the factors which make it challenging to share question level information.
Number of Subjects
The GMAT Exam does not measure your knowledge of a particular subject, but rather your ability to reason critically. A larger number of subjects is available than the number of questions included in any one exam. The subjects chosen for the GMAT exam are fundamental skills necessary for success in graduate business school and are therefore treated as interchangeable. This means you may see four Linear Equation questions the first time you sit for the GMAT exam and none the second time.
Difficulty of Questions
Questions presented during the GMAT exam vary in level of difficulty, that level is determined very much by the performance of the test taker. You may get two highly difficult Graduated Rates questions wrong the first time you sit for an exam because you have done very well and the difficulty is increasing. The next time you sit for the exam you may see a relatively easy Graduate Rates question at the beginning of the exam.
Number of Data Points
The GMAT ESR is intended to provide you an understanding of your strengths and challenges, this is done by showing you trends in your performance. Because there are such a large number of subjects with a significant range in difficulty, there is no informative trend analysis.
Yes, there is a great article, written by an instructor that has proven helpful for many people: How to Analyze the Upgraded GMAT Enhanced Score Report
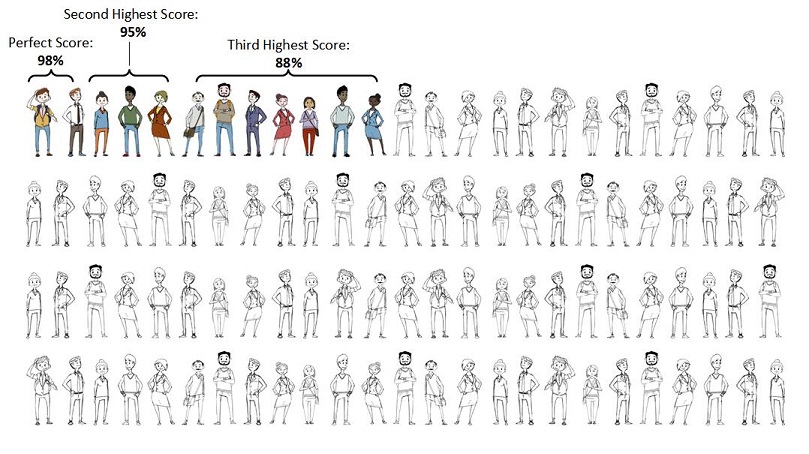
The Percentile Ranking Number is the percentage of test takers that you did better than.